

Green Software Engineering is a new and evolving branch of software engineering for building more sustainable systems. Using these types of techniques the tech sector can play its part in tackling the climate crisis and reducing our dependence on fossil fuels.
For running software electricity consumption is a key metric. Of course the source of that electricity and the carbon emissions embodied in the hardware are also important. However even if the electricity sourced consists of mainly renewable energy, consuming less electricity frees it up to be used for other purposes.
Scaphandre is a monitoring agent that provides energy consumption metrics. The project was founded by Benoit Petit in October 2020. The name comes from “heavy diving suit” in French. I’ve been fortunate to be able to help with the Kubernetes integration which this post focuses on and it’s given me the chance to learn some Rust. Scaphandre is developed in Rust to keep the footprint of the monitoring as low as possible.
However, Kubernetes isn’t required. Scaphandre will work on any bare metal server providing the CPU and kernel has RAPL support. A great example is this post on how BBC R&D uses it and the UK National Grid Carbon Intensity API to monitor their 2 OpenStack data centers.
The primary sensor in Scaphandre is called PowercapRAPL. RAPL (Running Average Power Limit) is a technology developed by Intel that is included in most Intel and AMD CPUs produced after 2012. In some cases it can also measure DRAM energy usage. PowerCap is a Linux kernel module that writes the energy consumption data to files in /sys/class/powercap and this directory is mounted by Scaphandre.
However, the RAPL sensor data alone is not enough to generate per-process metrics. Computers in general and especially servers in an orchestrated system are time sharing the work they do to run many tasks at one. To account for this the system uses small intervals of time known as jiffies. This data is available in /proc/stats and for each process in /proc/PID/stats. This directory is also mounted by Scaphandre and by combining it with the RAPL data the per-process energy usage can be calculated.
Check out the docs for a much deeper explanation of how this works.
For outputs, Scaphandre has the concept of exporters. In this post we’ll focus on the Prometheus exporter but other options are JSON, Riemann and Warp 10. The Qemu exporter is a special case. It runs on bare metal hosts and can expose metrics to Qemu/KVM VMs running on the host.
Metrics are exposed at the host, socket and process level. For Kubernetes workloads, these processes will be containers running on a node. The raw metric includes the PID of the container. However, complex applications may consist of multiple containers. So we add the pod name and namespace each container belongs to. With these extra labels we can link to any other metadata we need in Prometheus.
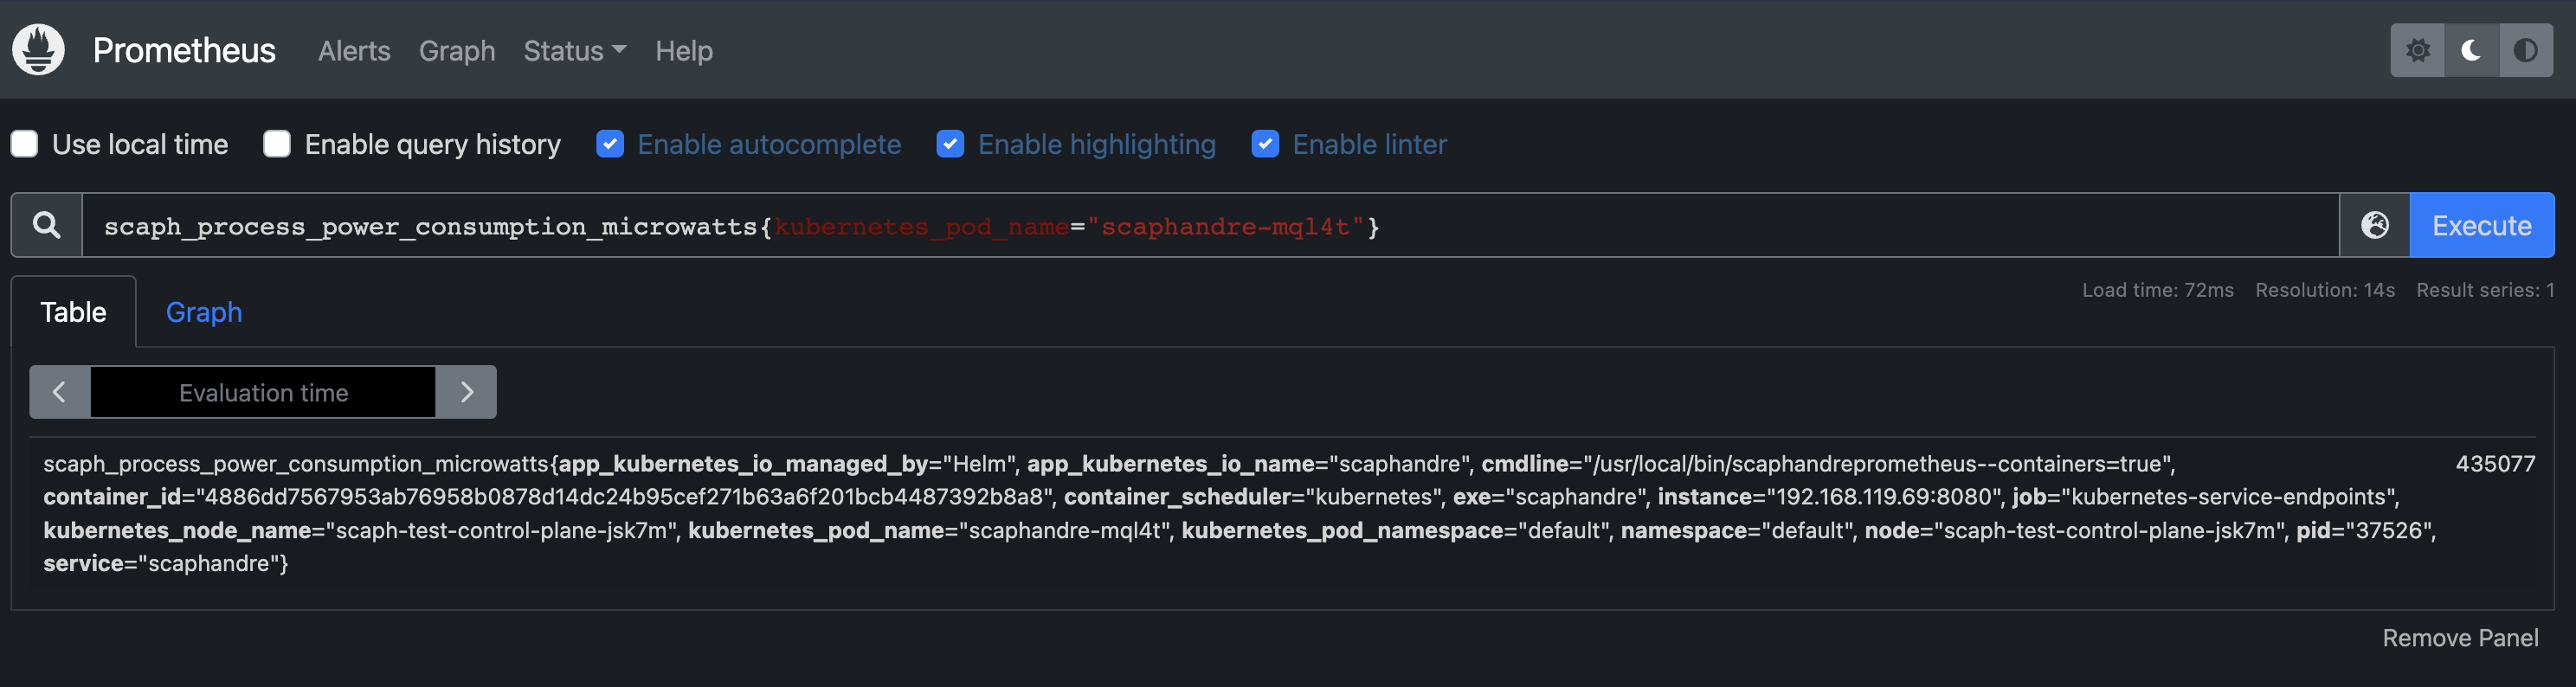
To do this, when Scaphandre is deployed as a daemon set with the --containers flag it will open an in-cluster connection to list the pods on the node. To link processes to pods, the cgroup file in /proc/PID/cgroup is parsed to get the container ID.
There are some challenges here as the format of the cgroup file depends on the cgroup driver used by the kubelet. We’re working to support all drivers but if you encounter issues please open an issue.
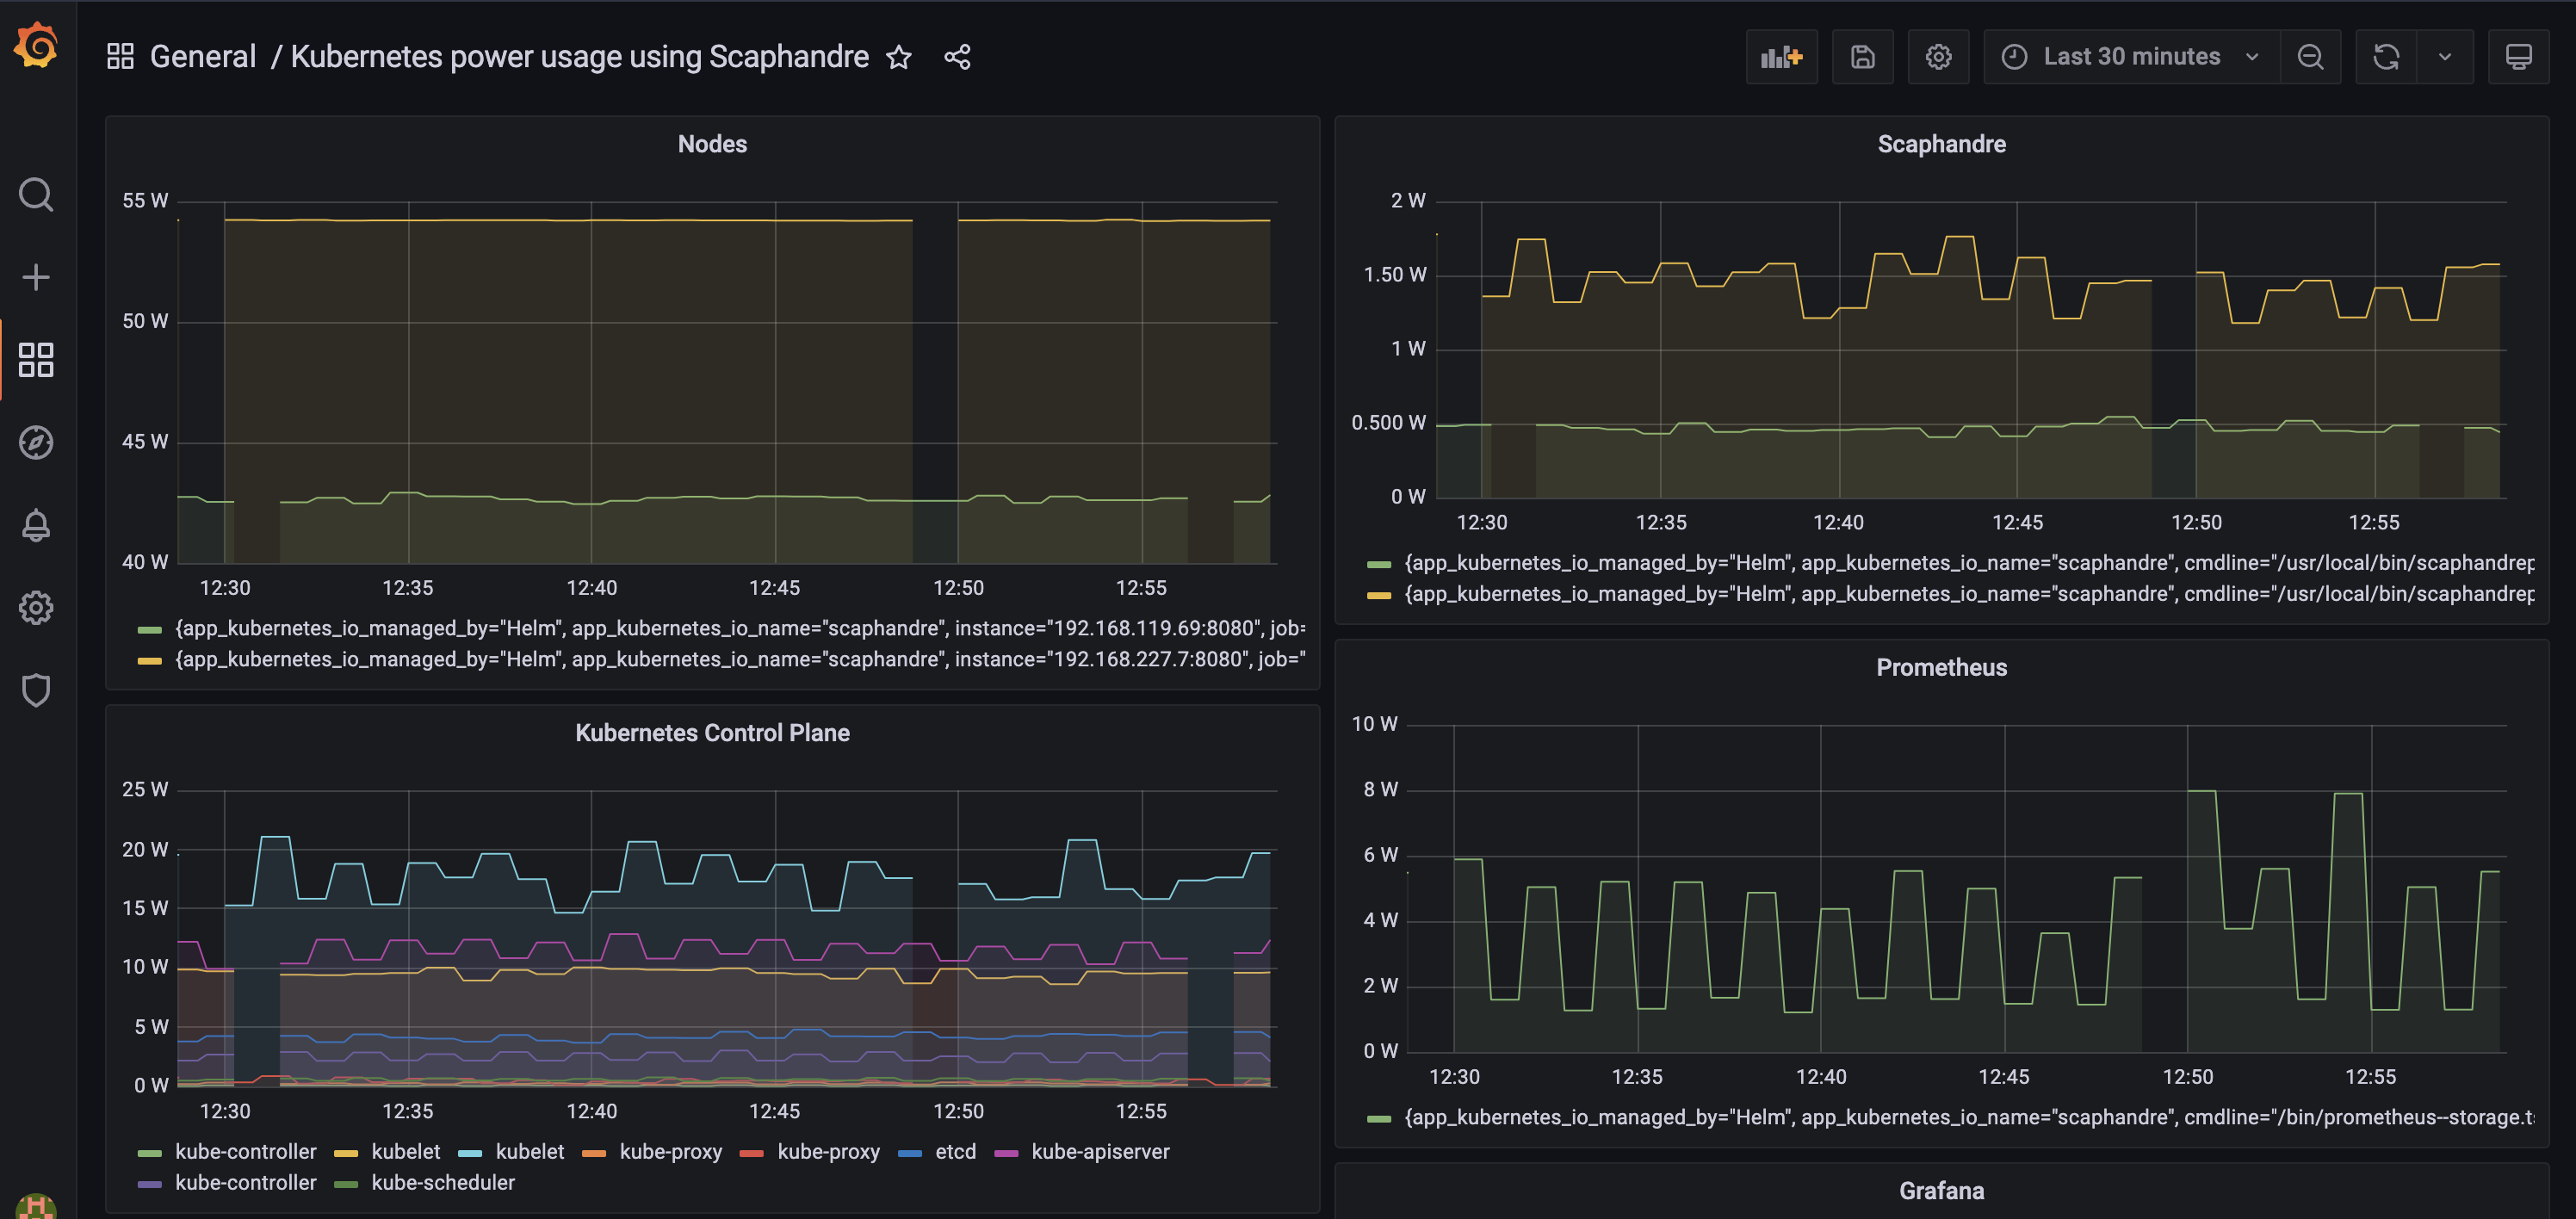
If you want to try out Scaphandre on a bare metal cluster there is a tutorial for installing it via its Helm chart along with Prometheus and Grafana to visualize the energy consumption of your cluster. Just be sure to check the compatibility docs to ensure your CPU and kernel are supported.
There is lots planned for the project including an estimation based sensor that will work with VMs including public cloud instances. So watch this space! Or even better, get in touch if you’re interested in contributing.
Photo by Gustavo Quepón on Unsplash.