

The Carbon Aware KEDA Operator was announced by Microsoft in April this year in a keynote at KubeCon EU in Amsterdam. Sadly I couldn’t attend KubeCon this time but it was good to see from afar that there were more sustainability talks and the great work the Environmental Sustainability TAG (Technical Advisory Group) is doing coordinating efforts across the CNCF and liaising with other organizations like the Green Software Foundation.
Carbon aware scheduling is an area of green software I’ve been interested in for some time. Last year I wrote about some possible approaches in a blog post for the Green Web Foundation. So once I’d tried the new operator I was keen to write about it.
The operator builds on top of KEDA (Kubernetes Event Driven Autoscaling) which is a CNCF project that in turn builds on top of the built-in Kubernetes Horizontal Pod Autoscaler. KEDA provides scalers for many components. Some of which run in the cluster like Prometheus or Kafka and others that run outside for cloud services like message queues. This allows KEDA to scale how many replicas of a container should be deployed based on these metrics.
Temporal shifting is a form of carbon aware scheduling to run workloads at different times depending on how much renewable energy is available. The alternative is spatial shifting to run workloads in locations where more renewable energy is currently available. However, moving workloads is not always possible due to data gravity or regulatory constraints.
Temporal shifting is also not possible for time critical workloads e.g. processing a credit card payment. However other workloads like encoding videos or training machine learning models can often be delayed for quite some time without impacting users. In fact Google uses this approach for processing videos uploaded to YouTube and files uploaded to Drive.
Carbon intensity metrics
Carbon intensity is a measure of how much CO2 is emitted per kilowatt-hour of electricity consumed. For an electricity grid this can vary widely depending on the generation mix of renewable energy (typically wind and solar) versus fossil fuels (coal and gas).
To be able to scale based on carbon intensity these metrics need to be present in the cluster. To do this Microsoft has released a 2nd component, the carbon-intensity-exporter. This uses the WattTime API as its data source.
I like how this is integrated as the exporter pod includes a 2nd container which is an instance of the Carbon Aware SDK running in API mode. The SDK is a tool developed by the Green Software Foundation and means that in the future the exporter can integrate with any data source supported by the SDK.
Another feature I like is that the exporter can be configured with the Azure region where the cluster is running. The SDK uses this to map the region to a geolocation. This is passed to the WattTime API and used to identify which grid this region is connected to e.g. the Azure westus region maps to the CAISO_NORTH grid region in California. Right now only Azure is supported but in the future, it would be great to see support for more cloud providers.
Now the exporter knows where it’s running it fetches the carbon intensity forecast for the grid for the next 24 hours and saves it to a configmap that is used by the operator. Every 12 hours the exporter will fetch a new forecast and save the updated data to the configmap.
apiVersion: v1
kind: ConfigMap
binaryData:
data:
  forecastDateTime: 2023-05-23 11:15:00 +0000 UTC
  lastHeartbeatTime: 2023-05-23 11:10:21.589054506 +0000 UTC m=+20.073269902
  maxForecast: "425.399821"
  minForecast: "27.466212"
  numOfRecords: "288"
immutable: true
metadata:
  name: carbon-intensity
  namespace: kube-system
The forecast itself is stored as JSON in the binaryData section of the configmap.
[
  {
    "location": "CAISO_NORTH",
    "timestamp": "2023-05-23T12:00:00Z",
    "duration": 5,
    "value": 327.255765552367
  },
 …
]
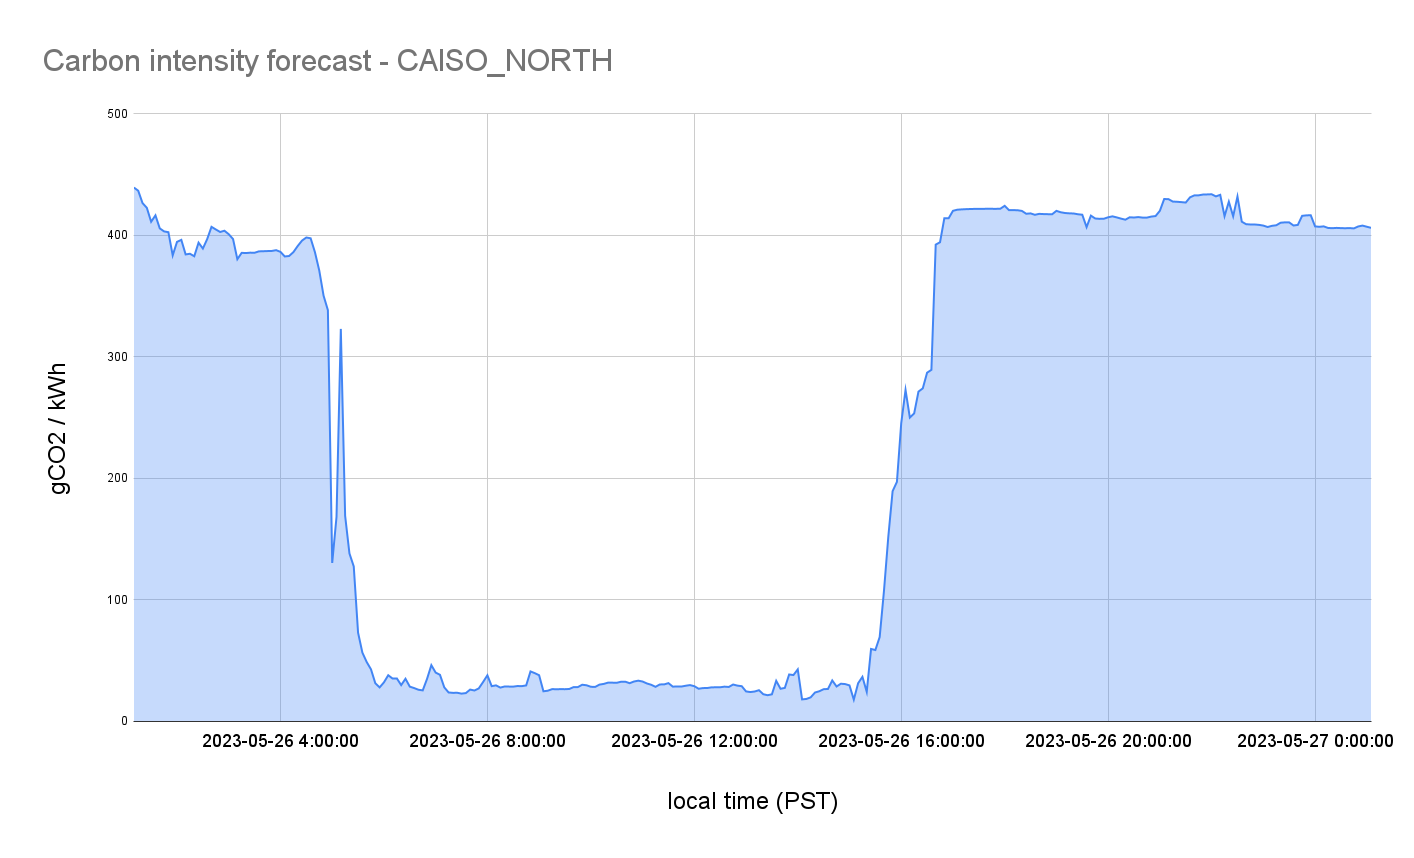
As you can see, for this day the best time to scale up is during daylight hours when solar energy is plentiful and before demand increases in the afternoon.
The configmap design is nice as you could also develop your own exporter with a different source of carbon intensity data. Provided the data format is the same it can be used by the operator.
Carbon aware scheduling is a new field and getting access to carbon intensity data is one of the main challenges. Both WattTime and Electricity Maps play an important role in this ecosystem by providing commercial APIs that provide both current and forecast data for multiple geographies. They both also have free APIs which are useful for some forms of carbon aware scheduling but don’t include forecast data which is important for temporal shifting.
Operator
To build on top of KEDA once an hour the operator sets the maximum number of replicas based on the carbon intensity data in the configmap. Based on configurable thresholds this means the workload can be scaled up or down depending on the carbon intensity. It is also possible to disable the scaling entirely at certain times e.g. when the system experiences peak loads.
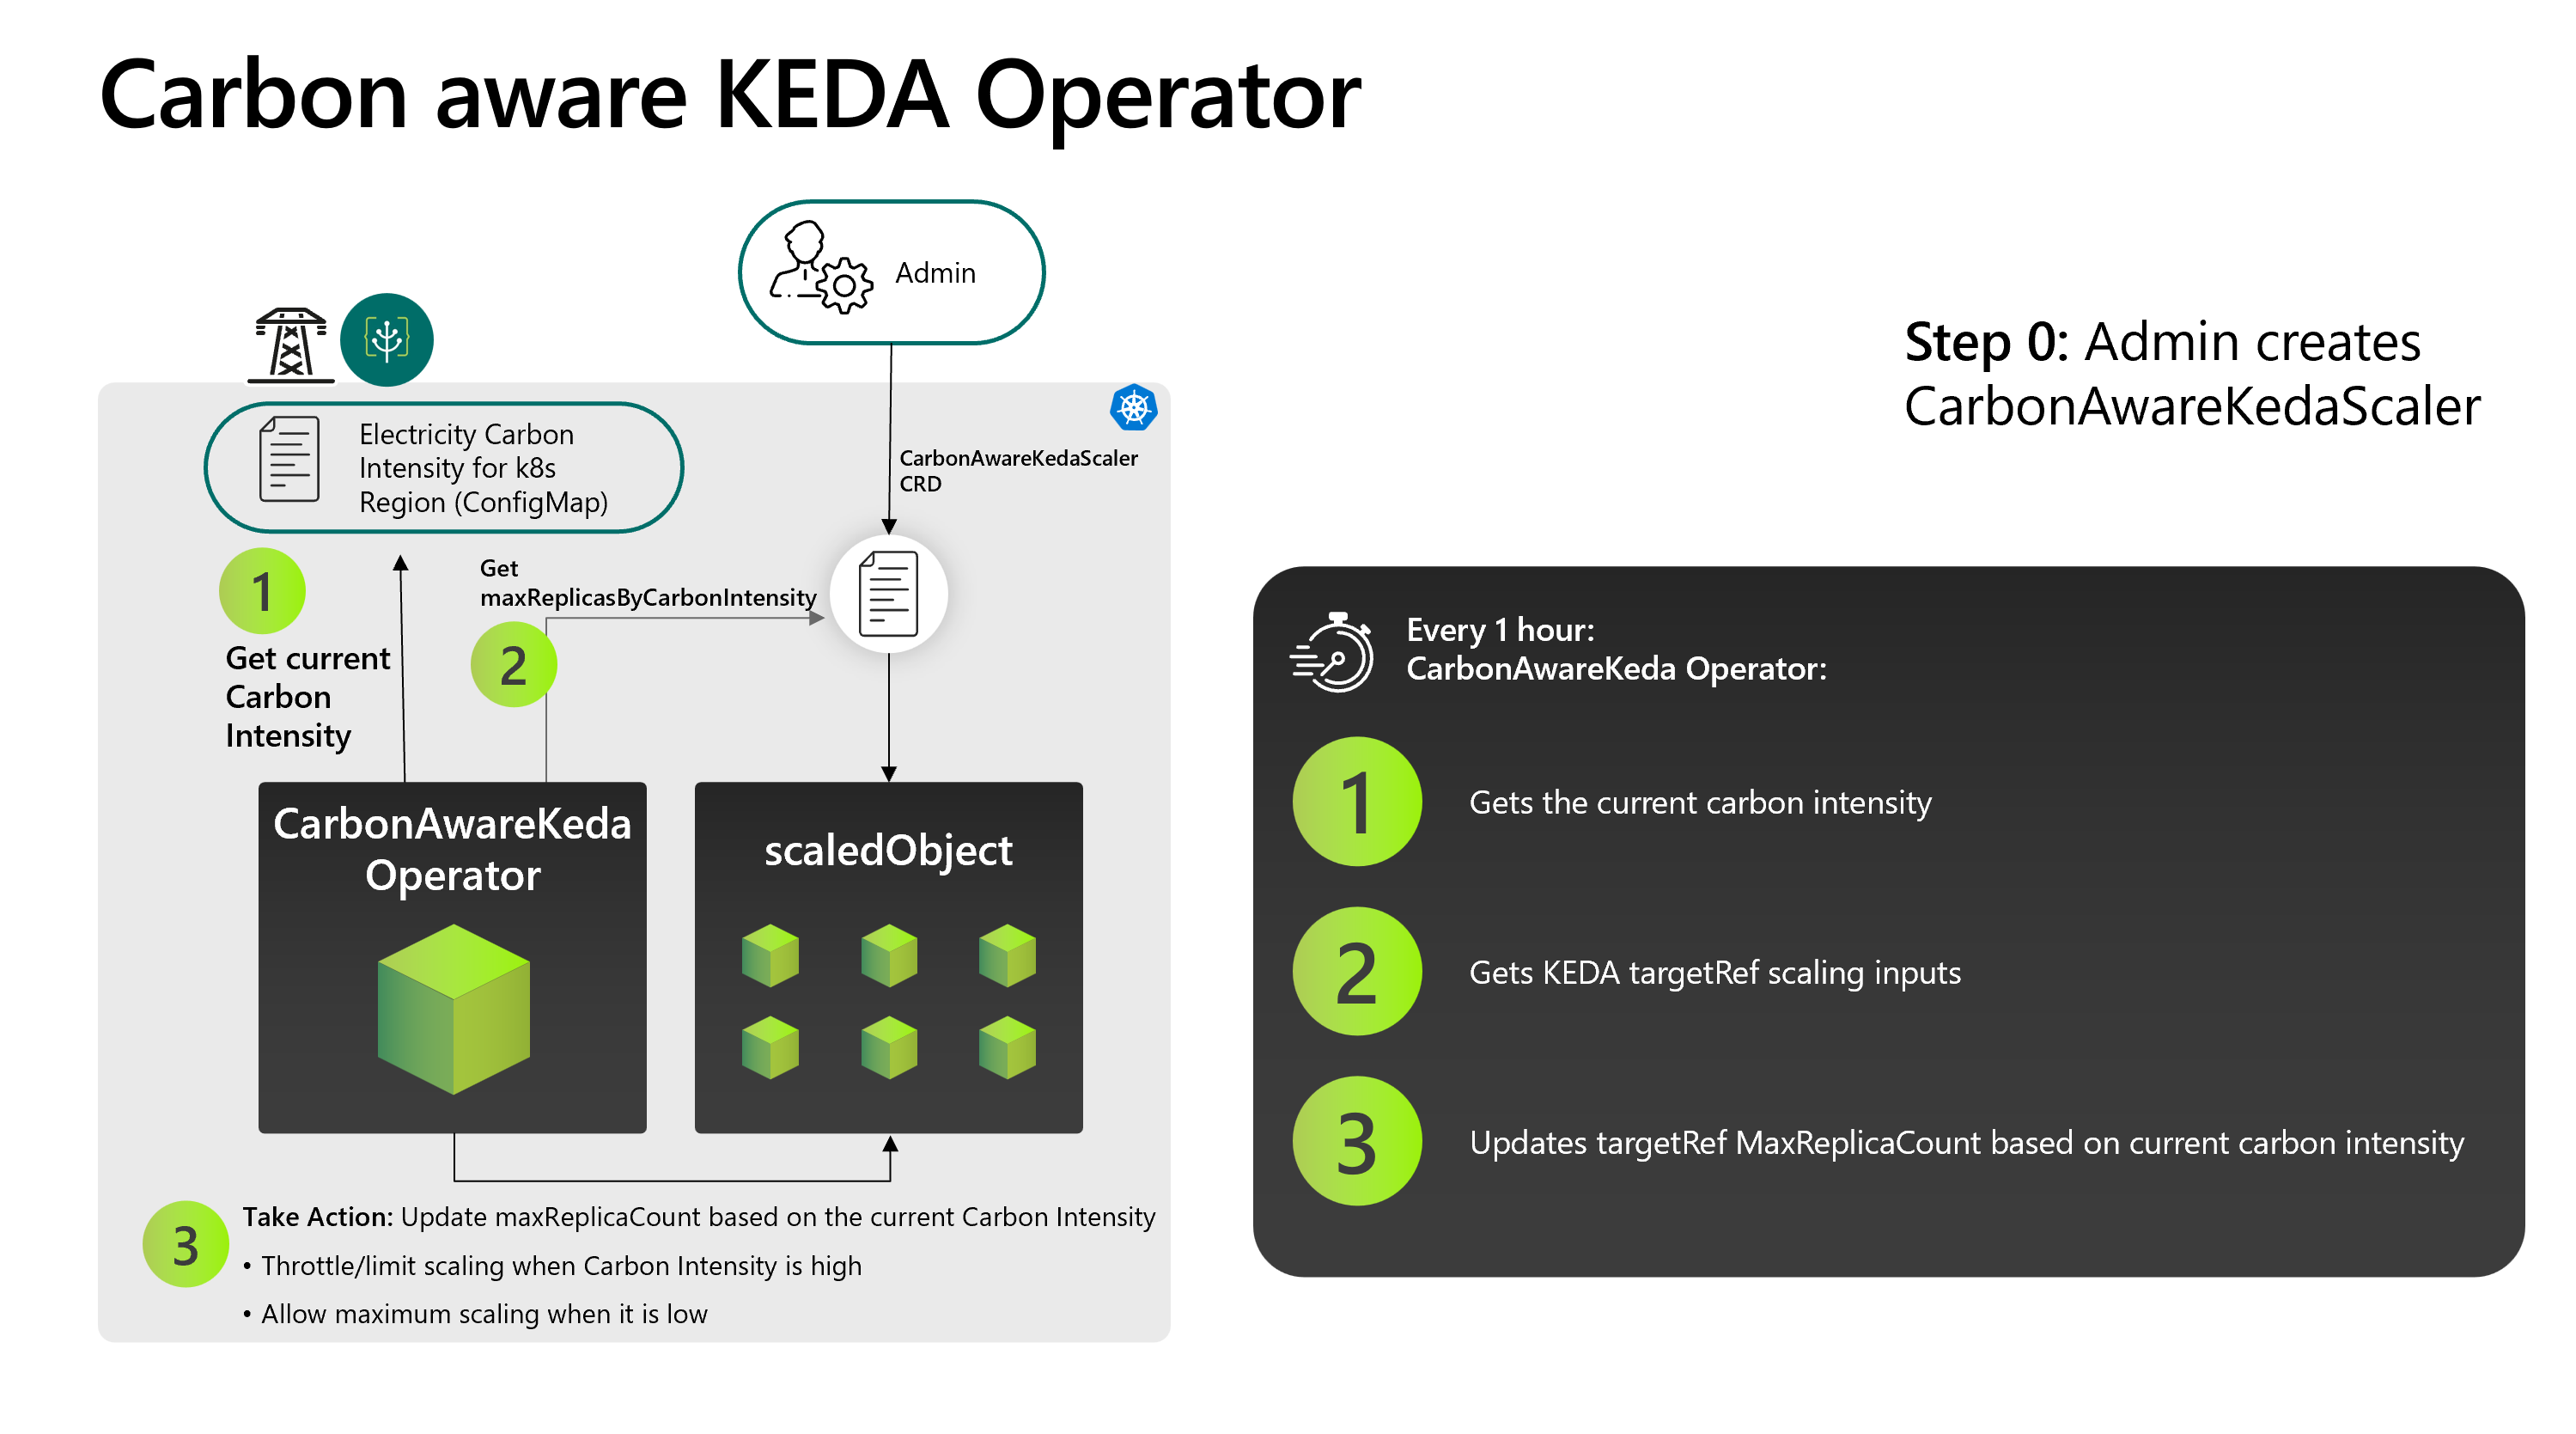
The design is implemented this way because the primary scaling mechanism remains the KEDA scaler. For the demo workload, this is the length of a Redis list but it could be any of the supported KEDA scalers. So the number of pods running depends on the length of the list but the operator sets the maximum number of pods allowed.
The design follows the standard operator pattern of extending the Kubernetes API with a CRD (Custom Resource Definition) and running a controller in the cluster that watches for these custom resources.
Let’s take a look at the custom resource for the demo workload.
apiVersion: carbonaware.kubernetes.azure.com/v1alpha1
kind: CarbonAwareKedaScaler
metadata:
  name: carbon-aware-word-processor-scaler
  namespace: default
spec:
  kedaTarget: scaledobjects.keda.sh
  kedaTargetRef:
    name: word-processor-scaler
    namespace: default
  carbonIntensityForecastDataSource:
    localConfigMap:
      key: data
      name: carbon-intensity
      namespace: kube-system
    mockCarbonForecast: false
  maxReplicasByCarbonIntensity:
  - carbonIntensityThreshold: 50
    maxReplicas: 110
  - carbonIntensityThreshold: 80
    maxReplicas: 60
  - carbonIntensityThreshold: 100
    maxReplicas: 10
  ecoModeOff:
    carbonIntensityDuration:
      carbonIntensityThreshold: 555
      overrideEcoAfterDurationInMins: 45
    maxReplicas: 100
    recurringSchedule:
    - '* 23 * * 1-5'
The kedaTarget and kedaTargetRef sections configure which KEDA custom resource should be managed. In this case, it is a scaled object that maps to a kubernetes deployment but it could also be a scaled job for batch workloads. The carbonIntensityForecastDataSource section configures which configmap to use as the source of carbon intensity data.
Most importantly the maxReplicasByCarbonIntensity section has the carbon intensity thresholds in gCO2eq/kWh and the max number of replicas for each. Lastly, the ecoModeOff section allows configuring when the scaling should be disabled and how many replicas to run during these periods.
For the configuration, the most challenging part is setting the thresholds. As the values to use depends on the electricity grid region. The exporter tries to help by storing the min and max forecast values in the configmap. However, as the docs recommend to have accurate values you should look at monthly and annual data for the grid region.
Conclusion
Both the operator and exporter can be run locally in a kind (kubernetes in docker) cluster. I had some problems locally due to a lack of resources for the prometheus stack that is also installed. Running in a GitHub Codespace as recommended in the docs was the quickest way to get up and running.
There is a proposal from Microsoft to donate the operator to the KEDA project which I hope will go ahead. Building on this first release it would be great to see the exporter support Electricity Maps as well as WattTime and configuring the geolocation manually for on-prem and other cloud providers. Similarly, the built-in support for Azure regions in the Carbon Aware SDK is great but having the same for AWS and Google Cloud would be very useful.
Since the amount of renewable energy available depends on whether the wind is blowing and the sun is shining by using temporal shifting we can run some workloads at times when the generation mix is cleaner. So I think it’s an important tool among the many tools we need to make our systems more sustainable.
Update: Marginal vs Average carbon intensity
Something I missed is that the WattTime API provides the marginal carbon intensity. This is calculated by identifying which power plant will provide the additional electricity requested. The alternative is to calculate the average carbon intensity for all power plants that are currently operating.
This is quite a complex area and there has been some discussion on which calculation is best to use. This blog post from Electricity Maps explains in more detail. For me this is another benefit of supporting multiple data sources in the carbon-intensity-exporter so users can choose which is best for them.
Update 2: September 2023
As of v0.2.0 of the kubernetes-carbon-intensity-exporter Electricity Maps is also supported. This was something I contributed so I was happy to be able to help with it.
Credits
- Photo by Dariusz Piosik on Unsplash.
- Carbon intensity data from WattTime.
- Carbon aware KEDA operator diagram from Microsoft.